Product Code: UN-SL-PM-CD
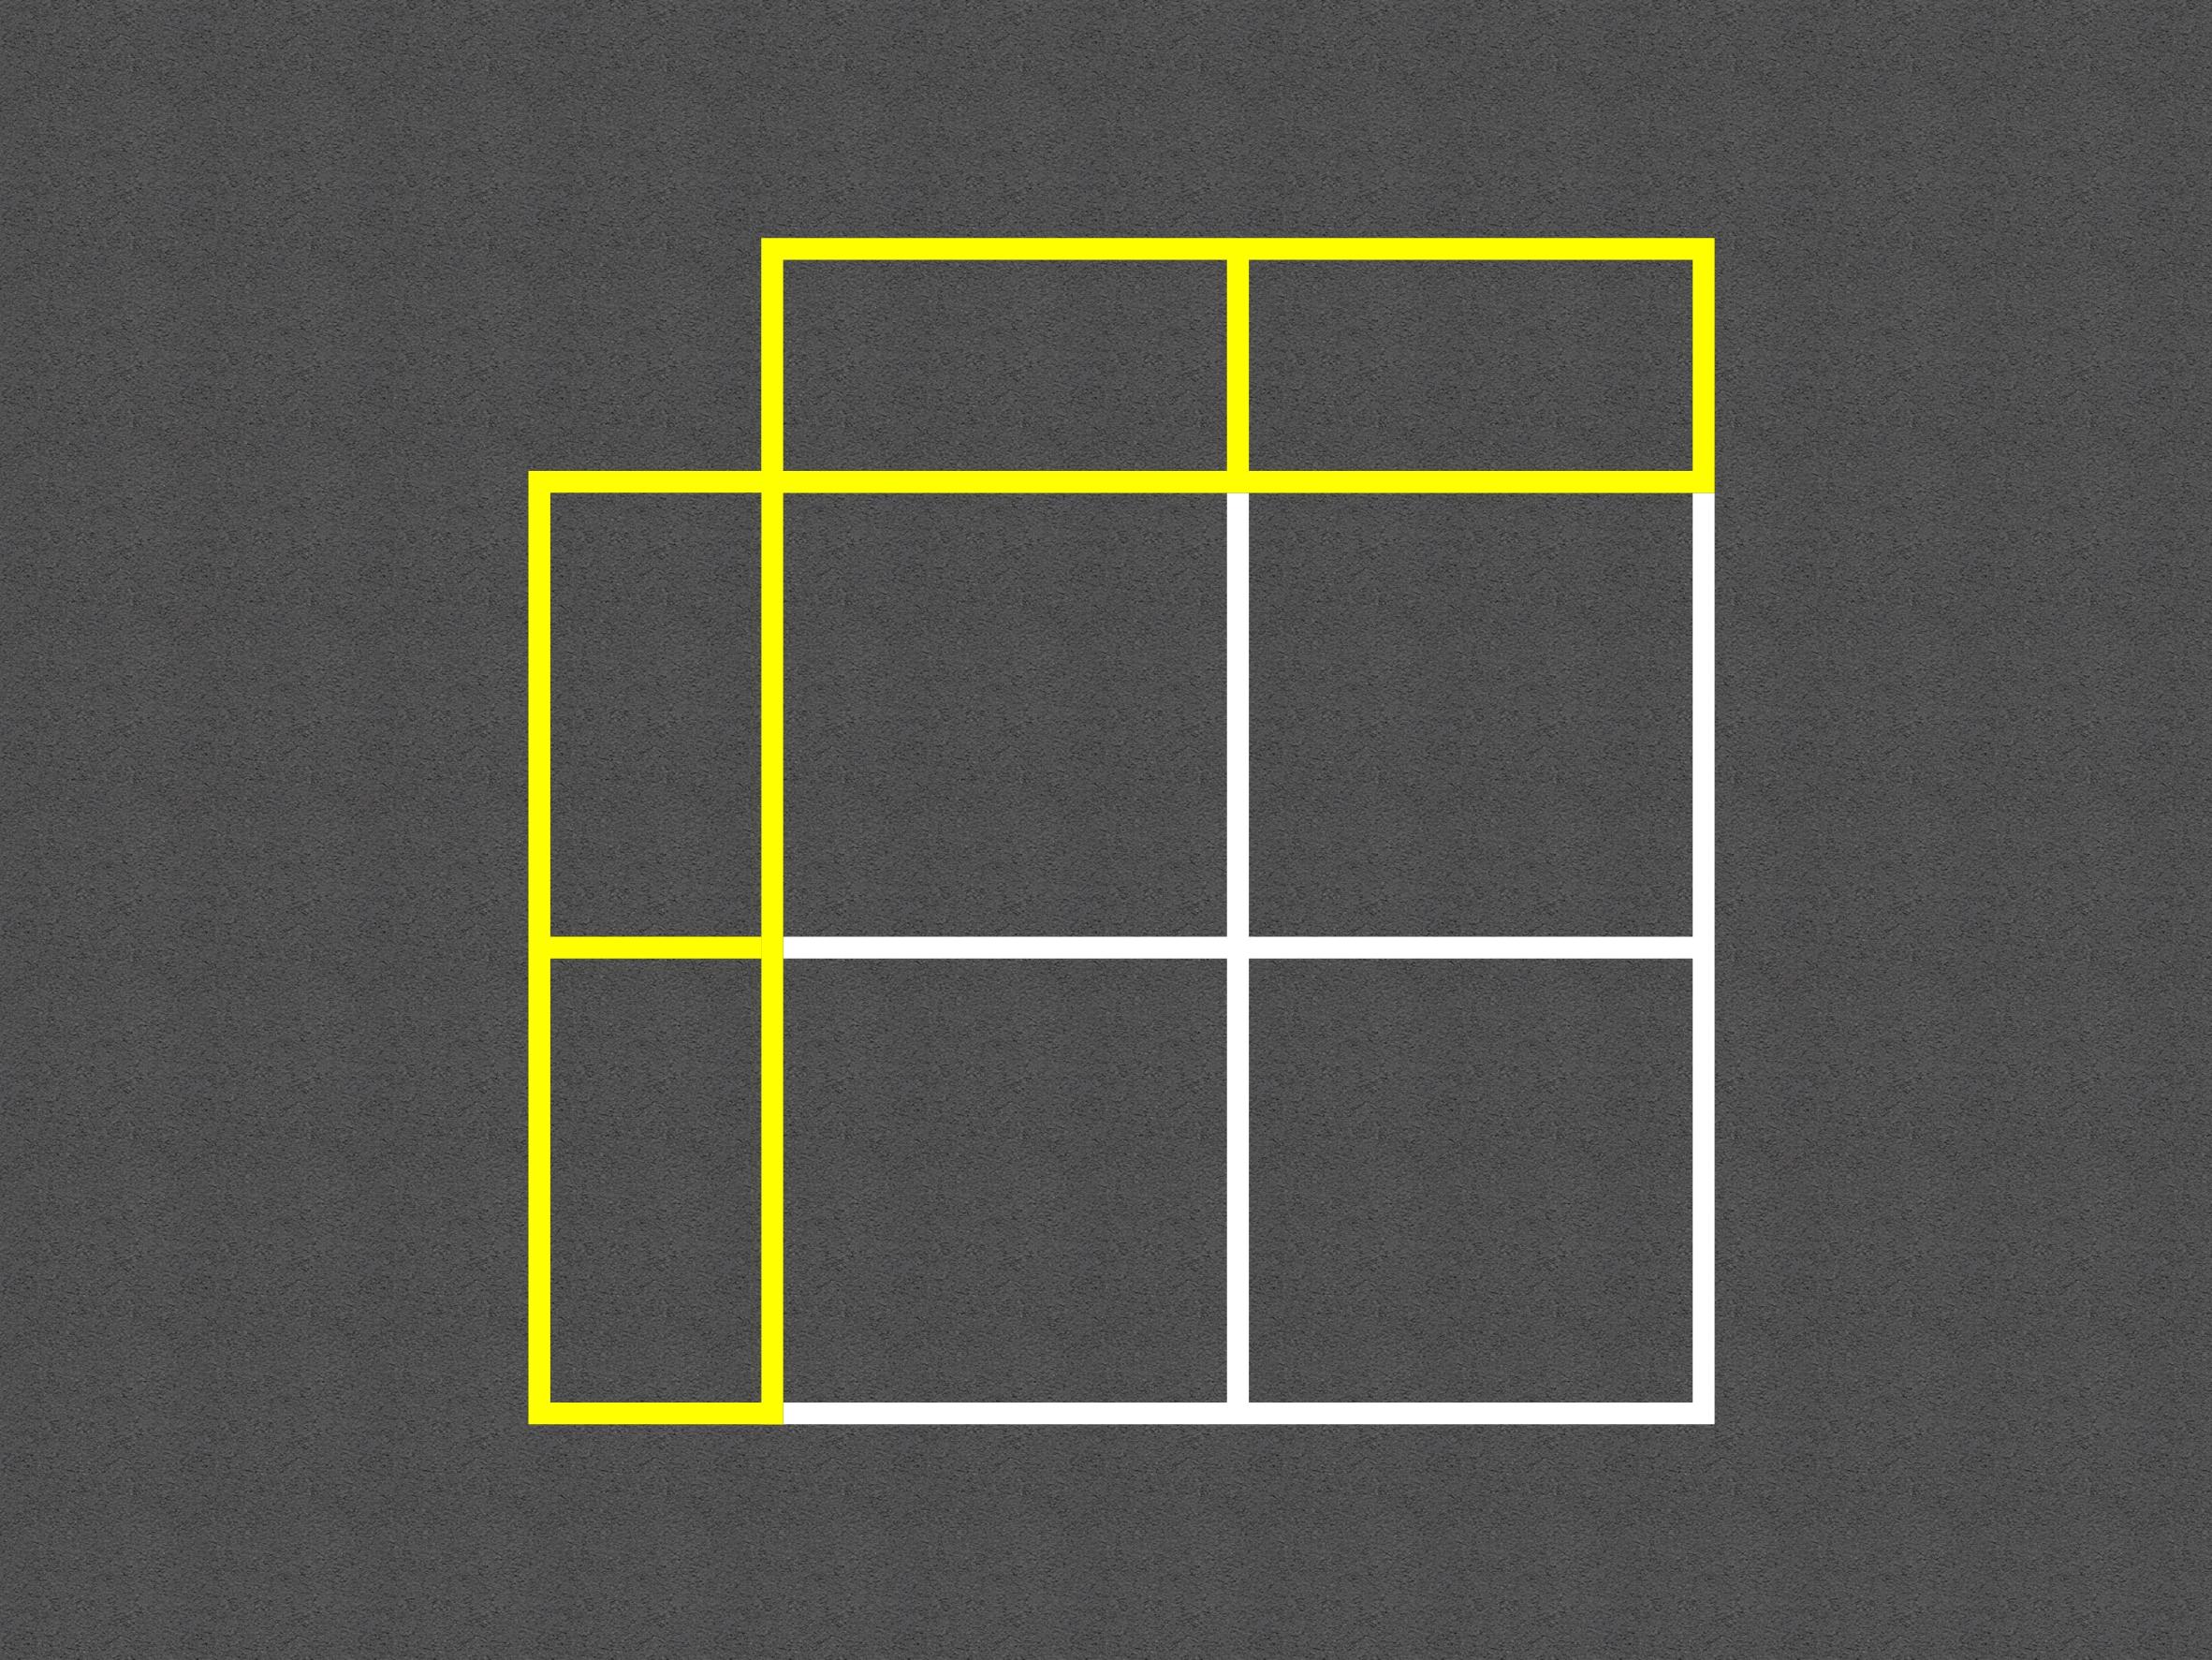
Carroll Diagram
Browse all Pentagon productsInstallation-only product
Please note this product requires installation from a Pentagon Play install team.
Enquire NowInstil a love of learning in your playground and use exciting resources to teach KS1 and KS2 children mathematical concepts, such as what a Carroll Diagram is and how to use it. The Carroll Diagram is the diagram used to teach primary school children to sort and represent data in a number of different ways; groups of objects or numbers are a few examples. The data is grouped in a 'yes or no' fashion making it simple and easy to understand the concept. Our Carroll Diagram Thermoplastic Playground Marking is a fantastic mathematics resource. Taking this important lesson outdoors and into a stimulating environment will fully engage children in the lesson at hand. Children will love using chalk or cards to sort numbers or objects into the diagram. The Carroll Diagram is also a fantastic tool for teaching mathematical concepts like multiples, more or less and odd or even.
Instil a love of learning in your playground and use exciting resources to teach KS1 and KS2 children mathematical concepts, such as what a Carroll Diagram is and how to use it. The Carroll Diagram is the diagram used to teach primary school children to sort and represent data in a number of different ways; groups of objects or numbers are a few examples. The data is grouped in a 'yes or no' fashion making it simple and easy to understand the concept. Our Carroll Diagram Thermoplastic Playground Marking is a fantastic mathematics resource. Taking this important lesson outdoors and into a stimulating environment will fully engage children in the lesson at hand. Children will love using chalk or cards to sort numbers or objects into the diagram. The Carroll Diagram is also a fantastic tool for teaching mathematical concepts like multiples, more or less and odd or even.
